Newmont Mines Greenhouse

In 2001 we were pleased to assist Newmont Australia Limited (formerly Normandy Mining Limited) in a review of their Greenhouse Challenge action plans across all their mine sites in Australia. We were engaged to review existing greenhouse gas abatement projects and identify new greenhouse gas abatement projects as part of Newmont’s Greenhouse Challenge commitment (formerly Normandy) at six nominated mine sites.

This process required a site inspection of each Newmont mine (formerNormandy) in Queensland, Western Australia and the Northern Territory. We reviewed existing action plans and inspected the facilities at each location to identify and produce a list of economically feasible energy and greenhouse gas reduction projects.

Projects were documented as part of Newmont’s revised action plans.

Identified Projects
A wide range of possible projects were identified including:
site load shedding control systems for a/c, pumping and some process management,
crusher circuits optimisation,
control of primary and secondary underground ventilation fans for underground workings,
improvements to power generation (where applicable),
water management and pumping for both underground and surface operations,
solar heating for domestic hot water,
solar heating to supplement process heating needs,
low volume shower roses,
use of variable speed drives,
use of reflective heat shields,
compressed air systems for both underground and surface,
haulage road surfaces and routes, and
contractor involvement in energy efficiency.

The mine sites covered in this exercise were Pajingo (Queensland), Bronzewing, Jundee, Wiluna and Golden Grove (Western Australia) and Tanami (Northern Territory).

A view of Bronzewing Operations

For each identified project, the capital investment was calculated with the return on that investment. In total, economically viable projects that would provide annual greenhouse gas savings of about 31,000 tonnes CO2 equivalent were recommended. For these projects, the estimated investment would be recouped in about twelve months.

Some other recommendations were made about training and improving the existing emissions database across the mine sites.


A view of Bronzewing Camp

A link to Newmont’s web site appears on our clients page.

A view of Tanami Operations

Further information about efficiency improvements in Newmont’s operations may be found at the AGO website here.

Centennial Coal’s Greenhouse Challenge

In 1999 we were pleased to assist The Centennial Coal Company Limited with their initial Greenhouse Challenge Co-operative Agreement with the Commonwealth government.

In 2001, we provided further assistance to Centennial to report on the original agreement and revamp that agreement to take account the changing number of coal mines in Centennial’s portfolio.

A revamped database has been constructed for the group. As each operation is different and has site specific circumstances, it was decided to set key performance indicators and targets for each mine site. The group performance then would be the sum of the performances from each mine. In this way, any unexpected or unplanned variation from the expected results could be tracked to individual mine sites. Also, for each mine we assisted in identifying and documenting efficiency improvement projects that would lead to greenhouse gas emissions savings. The projects covered process, production and energy improvement matters.

Also, this overall approach would allow other mines to be added easily to the group or mines to be removed from the group, if for example a mine had reached the end of its life.

A distant view of Centennial’s operations at Cook in Queensland

The public statement from the 2000 Greenhouse Challenge report for Centennial reads as follows:

Company Progress
In 1995, greenhouse gas emissions from Centennial Coal’s operations were about 17,200 tonnes of carbon dioxide equivalent global warming potential (CO2 GWP). In our original 1995 emissions inventory, reported at the start of Centennial’s commitment under Greenhouse Challenge, we reported a figure of 17,800 tonnes CO2 and the difference is due to more accurate information becoming available.

Centennial has achieved significant reductions in CO2 per tonne run of mine (ROM) Coal produced between 1995 and 2000 primarily due to continuous improvement programs.

Centennial has in place an expansion program to take advantages of opportunities that become available and that meet the company’s investment criteria. One example is the acquisition of Springvale Colliery which has occurred since Centennial joined Greenhouse Challenge in 2000. Other acquisitions or divestments are possible in this dynamic environment. The effect of changes of this nature will be to change our emissions inventory and per unit performance indicators.

With this in mind, Centennial has adopted individual key performance indicators (KPIs) for each mine site against which greenhouse performance will be measured. This is a change from the group performance indicator which was adopted on joining Greenhouse Challenge.

Emissions Update
Total Emissions for the 1999/2000 year were 218,538 tonnes CO2 GWP which included fugitive and non-fugitive emissions resulting from our business operations and in the 2000/2001 year these emissions were 231,792 tonnes CO2 GWP. The emissions from energy use in these years were 49,968 and 63,402 tonnes CO2 GWP respectively.
The increase in total emissions since 1995 has been due mainly to fugitive emissions from one additional underground mine to the group. It is possible that fugitive emissions from our operations may increase further depending on changes to the company’s mine portfolio. The increase in emissions from energy use since 1995 has been due to additional mines in the group and greater coal production.

Action Plan Achievements
When considered against the adopted key performance indicators for each mine site, the aggregated emissions for the group amount to 5,400 and 13,400 tonnes below the emissions predicted for 1999/2000 and 2000/2001.

These savings have been due to management initiatives and Centennial’s drive for improved efficiencies. Additional savings are expected from specific greenhouse projects.

A view of Centennial’s operations at Clarence which features codisposal of washery rejects

Centennial’s experience with Greenhouse Challenge provides a good example of how the programme can benefit both the organisation and the environment. Benefits to the company include an improved efficiency with reduced costs as well as enhanced employee awareness and an improved working culture.

A link to Centennial’s web site appears on our clients page.

James Hardie Group Saves $1 million

Reprinted from James Hardie Energy News – December 1984

Whilst this story occurred some time ago now, we think that it is worth repeating here because the principles are highly relevant and applicable today.

Since 1981, when the Group Energy Conservation Programme was initiated much has been achieved and learnt culminating in energy savings totalling one million dollars for 1983/1984.

Addressing the concept of energy management four years ago, the daunting task of gathering, preparing, analysing and acting on vital information in such a diverse and large group as James Hardie began with the assistance of consultants.

The Group Energy Conservation Programme was established and four phases of action were planned. Phase 1 of the programme, called the ‘Base Year Energy Audit’, involved the gathering of all the information necessary to determine how much energy was being used by the group, the cost of this energy and where it was being used.

The cost of the differing types of energy and their use were also recorded.

Phase 2 called ‘Plant Energy Surveys’ determined energy usage and cost at individual factories, warehouses and offices. As was expected electricity was the most expensive form of energy used throughout the James Hardie group. Investigations into the purchasing of electricity revealed that some sites were able to improve their costs through changing to appropriate tariffs. Under Phase 3 or ‘Energy Monitoring’ of the programme, a sophisticated system was established using the group indicating such things as energy use and performance and costs. This enabled each site to evaluate their own progress and to set new targets.

Phase 4 involves the transfer of the responsibility for the continuation and further success of the Energy Conservation Programme to the business groups and this should occur early in 1985. Throughout the programme it has been a priority to obtain full cooperation and support from all the staff to achieve the success required. Apart from involving those directly responsible for various tasks within the programme, all needed to be informed and made aware of the great advantages of the programme for success at all levels. The James Hardie Energy Newsletter was conceived for this purpose. This edition is the fourth to be published.

The benefits of the group energy conservation programme are obvious. Increased savings contribute to increased profitability and therefore increased growth. Perhaps the greatest benefit has been the effect that the programme has had on staff at all levels of the organisation. Technical staff have been required to keep abreast of the latest technology especially where the purchase of new equipment is concerned.

Greater communication has been achieved across the group through the programme and its experiences. An element of competition has been introduced between plants manufacturing similar products to see which operation can be the most efficient which can only be healthy to the group as a whole.

The depth of the James Hardie Energy Conservation Programme has shown what can be achieved through a systematic concerted effort. The rewards are great, the expertise gained is invaluable.

Contact us (phone 02-9871 6641) if you would like further information about Energy Conservation Programmes or any assistance with energy management.

Minerals Industry Greenhouse Challenge Workbook

In 1996, we were engaged by the Greenhouse Challenge Office (now the Australian Greenhouse Office), the Minerals Council of Australia and the Australian Coal Association to produce a workbook for the minerals industry. The engagement was with Colin Randall (of C Randall & Associates) and Peter Stewart (of Molino Stewart) and the task was to produce a comprehensive workbook to assist industry members join and participate in the Greenhouse Challenge Program.

The workbook was completed in late 1996 and workshops held for the industry in NSW, Vic, SA, Qld, NT, and WA in early 1997. Feedback from the workshops indicated that the workbook had been favourably received. Copies of the workbook may be obtained from the Minerals Council State offices though the multipliers used in the calculations would need to be updated from the AGO web site.

The workbook contains generic greenhouse gas abatement projects relevant to the industry, a flow chart of the steps in the Challenge Programme and spreadsheets to get you started.

The Greenhouse Challenge Programme is a voluntary program between the Commonwealth Government and industry. Participants agree to:
establish an emissions inventory of greenhouse gases that result from their activities,
monitor and manage those emissions,
set greenhouse gas emissions targets (may be total or per unit targets),
identify projects to reduce greenhouse emissions,
implement projects that are economically viable,
monitor the results against targets, and
report annually to the Australian Greenhouse Office (AGO),
issue a public statement about their progress with the program.

The various components of the programme to meet these requirements are:
An emissions inventory for the base year (starting year) and emissions projections for future years – say the next five years.
The emissions inventory should be established for each site, then aggregated across the group.
Greenhouse Strategies and Projects for each mine site in the group,
Greenhouse Gas Emissions Abatement Action Plans (for each site), including the possibility of group wise Actions (policy/awareness/purchasing),
An initial Public Statement on commitments in the cooperative agreement.
Monitoring (internal at each site, plus overall review across the group),
Project Implementation,
Project review and identification of new projects, and
Annual Reporting to AGO.

The flowchart pictured shows the steps in the program.


The table below lists the Generic Projects from the Workbook:
 Generic Greenhouse and Energy Projects
Energy Management     
1
Energy Audit
2
Energy Management Program
3
Energy Monitoring as a Management a Tool
Energy Projects
4
Air Compressors and compressed air systems
5
Bathhouse heating systems
6
Boiler Controls Steam Systems
7
Building Air Conditioning and Space Heating
8
Buildings – Insulation and Shade
9
Collect methane and use to generate electricity
10
Combined Heat and Power (Cogeneration)
11
Computerised Energy Management System
12
Drive Belts and Coupling Systems
13
Fuel Efficient Diesel Engines
14
Fuel Substitution: electricity instead of diesel
15
Fuel Substitution: LPG/CNG instead of diesel
16
Furnace Controls and Improvements
17
Heat Pumps
18
Heat Recovery
19
High Efficiency Electric Motors
20
Lighting Systems
21
Optimisation of Face Shovel and Dragline Performance
22
Remote Area Power Supplied Photovoltaic Panels
23
Solar Water Heating
24
Trolley Wire Assist for Haulage Trucks
25
Variable Speed Drives for Pumps
26
Variable Speed Drives for Fans
27
Ventilation Systems
Chemical Processes
28
Energy efficient metallurgical processes
29
Fine Grinding Technology
30
Flare methane
31
Oil Reclamation System
32
Substitution of Chemicals in Recovery Process
33
Water Management
Mining Processes
34
Alternative Transport Overland Conveyors
35
Codisposal of Fines
36
Larger trucks shovels graders
37
Minimise blasting of coal – Use hydraulic backhoe
38
Recover coal to reduce spontaneous  combustion/improve recovery of resource
39
Reduced weight of dragline and shovel buckets
Explosives
40
Blast Management
Training
41
Teach staff to identify ways to improve energy efficiency
Environmental
42
Clearing vegetation from areas to be inundated by dams
43
Tree plantings/Revised rehabilitation programs
44
Alternative feeds for agricultural animals
Contact us (phone 02-9871 6641) if you would like further information .

Peabody Resources Limited Greenhouse Challenge

In 1997, we were engaged by Peabody Resources Limited (PRL) to prepare their Greenhouse Challenge Cooperative Agreement for their two mines, Ravensworth and Warkworth in the Hunter Valley, NSW, and make allowance for the inclusion of the new Bengalla operation near Muswellbrook, NSW.

A significant part of the project involved developing appropriate Greenhouse Response Strategies, economically viable projects to reduce greenhouse gas emissions and the documentation of all actions and action plans. Also included was the development of the emissions database for individual sites and a summary database for the group. Suitable key performance indicators and performance targets were set for each mine and for the group.

As expected, the project required in depth consultation at each location and with senior staff about all aspects of their operations.

For Bengalla, we were asked to prepare an energy efficiency design philosophy against which the mine was designed and subsequently built. The next part of that exercise required establishing a baseline energy and emissions performance against which the mine could be measured, together with
performance targets.

In the final year of the original Cooperative Agreement for PRL, 2000, the operations of the Moura mine in Queensland, that had been acquired by Peabody, were added to the group emissions inventory. At the same time, greenhouse gas abatement projects were identified for Moura and action plans developed. The coal seam methane gas recovery system at Moura provided greenhouse emission credits from the captured methane with the potential for significant credits in years to come as the production from the facility is increased.

For PRL the whole exercise has been most successful with the group showing a significant reduction in per unit energy, greenhouse gases and energy costs over the years worth millions of dollars. A visual presentation of PRL’s results is shown in the figures above.

Digging Out the Savings

Reproduced from Energy Focus: June 1995

A study commissioned by Orion Energy, formerly Shortland Electricity, and Pacific Power has suggested that open cut coal mines in the Hunter Valley region of NSW could reduce energy costs by an average of up to 20%.

Denis Cooke of Denis Cooke and Associates and Colin Randall of C Randall and Associates, presented a paper on the findings to the annual conference of the Australian Institute of Mining and Metallurgy at the end of February this year.

Entitled ‘Energy Use Benchmarks for Open Cut Coal Mines’, it showed that energy costs are generally equivalent to annual profits.

This, they said, indicates that a saving of 20% in energy would directly result in a 20% improvement in mine profit.

In some of the mines surveyed, the saving could be as much as one or two million dollars per year!

Denis and Colin were awarded the contract to carry out the study following a tender process.

Denis is an energy efficiency consultant and Colin a consultant in efficient coal mine operation. The study was part of an initiative begun in April 1994 by Orion Energy and Pacific Power. Its purpose is to:
increase understanding among customers of the benefits of energy efficiency and of the benefits of efficient and effective use of electricity, and
achieve increased efficiency in the use of energy in open cut coal mining

The study was formulated to produce credible and meaningful information that could be used to achieve commercial benefits by Pacific Power, Orion Energy and their mining customers.

Its aim was to establish “benchmarks” by which widely varying operations could compare their energy efficiency, ascertain whether improvements were possible and determine the strategy required to achieve improved energy efficiency.

By world standards energy is cheap in Australia but it is still a significant and controllable part of operating costs. Mining management has generally looked at consumption on the basis of cents per litre of diesel or kWh of electricity and the maximum demand charges for electricity.

With few exceptions, the actual monitoring of the efficiency of utilisation of energy is not common in the industry. Equipment efficiency has mostly been assessed according to manufacturers’ energy use specification and not measured in real working conditions in the specific location.

The study found instances where electrical monitoring and recording equipment said to exist often did not, was not properly hooked up or was providing data that was difficult to interpret.

What is not measured cannot be saved, so Denis and Colin collected electricity use data from in-house metering transducers where available or used portable metering equipment. Data was downloaded through data loggers to a PC for comparison with Orion Energy billing information.

Apart from at the coal face, load surveys were undertaken in mine workshops, on conveyor belt motors, in the coal preparation areas and even in mine bathhouses, where it was found there was room for significant energy savings. The study suggested that high efficiency, ground source heat pumps could be looked into for water heating plus space heating the bath houses together with adjacent office and workshop areas.

Denis and Colin encountered similar problems when collecting data on the use of diesel fuel. At one site it was asserted that mine trucks were fitted with on board data logging of fuel consumption but this was found not to be the case.

Historical purchase data was collected but the cost factor had to be adjusted because the mines don’t all pay the same price per litre. Some purchase and store bulk stocks while others prefer the supplier to maintain an onsite facility so that fuel can be purchased as required.

Some anomalies were found. The use of diesel had doubled in a year at one site without any change to output or operating conditions!

The use of contractors who buy their own fuel was a complication as all fuel and electricity use on each mine site studied had to be ascertained and factored in to make the study complete.

The information on electricity and diesel use that was collected was used to calculate mine efficiency on the basis of megajoules and cents per bank cubic metre (BCM) of material moved including coal, the end product of a mine!

This can be used as a common basis of comparison as long as all factors that can vary the equation are taken into account. These can include the ratio of electric to diesel power, whether the mine uses a dragline or electric shovel for overburden removal and especially the amount of overburden that must be removed to reach the coal. A site with a high overburden ratio could be expected to have a higher energy consumption than another site with a lower overburden ratio.

The study found major factors affecting energy efficiency in mining include equipment design, machine matching, explosive factor and degree of fragmentation, drilling patterns, bench heights, floor conditions, dip of working floors, shovel/truck loading systems and shift arrangements.

In materials transportation the factors are equipment design, gradients, payloads and required delivery rates. In coal preparation the main factors include plant design, plant processes and flow, for coarse and fine coal, particle size distribution, coal quality – especially reject percentage, mixture content and material balance.

A significant observation during the study involved the variability of electric shovel operation. Shovels driven by skilled operators performed smoothly while those operated by less skilled drivers moved erratically and harshly.

Energy consumption was higher when the equipment was being handled badly. This could be expected to also result in higher maintenance costs in the future. The greater the energy efficiency, the lower the maintenance costs due to less stress, reduced vibration, lower operating temperature and the absence of shock loadings.

Much of the equipment seen was being operated well below designed maximum load levels. In some case this made energy use figures look good until they were compared with output or BCM!

At times of low production, individual modules in modular coal preparation plants could be shut down to keep remaining modules operating at peak capacity and efficiency. Some coal preparation equipment was found to be over designed for the projected workload. Identifying these areas, re-rating them for higher output, instead of adding new plant, could result in energy savings per BCM and reduce the need for further capital input.

Specifying larger equipment can also be of value provided it is worked at maximum load and matched with appropriately sized equipment .. bigger trucks can carry more coal providing they have a bigger shovel to load them! Denis and Colin concluded that all mines could benefit significantly from the introduction of energy management principles and establishment of energy policies for new and existing facilities.

They said using electricity instead of diesel wherever possible could result in large savings. An example is drilling equipment used to prepare blasting holes. Diesel powered drills are often chosen over more efficient electric drills because they can propel themselves around the mine but the drills are most often carried around by low loaders. Alternate fuels such as natural gas or LPG could also be considered as major manufacturers now make alternate energy versions of diesel engines. The study showed that on average mines could reduce energy bills by 20% but some could expect cost reductions of 25% or even more.

Contact us (02-9871 6641) if you would like further information or would like assistance with Energy Management and Energy Performance Benchmarking in mining.

Bathurst City Council Budgeting Bathurst’s Bathwater

Reprinted from Energy Focus Magazine 1993

When residents of Bathurst, in the Central West of NSW, turn on the tap to fill the bath or make a cup of tea they are probably unaware of the efforts being undertaken to get their water to them as cheaply as possible.

Water and sewerage services are provided by the Bathurst City Council.

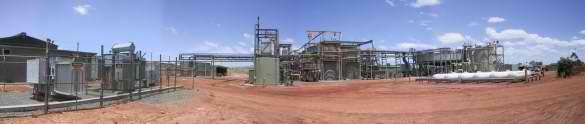
The Macquarie River is used as the “conduit” to transport water from the Chifley Dam to a pumping station outside the city.

The water is then processed through a filtration plant before being pumped to reservoirs for gravity feeding to the users.

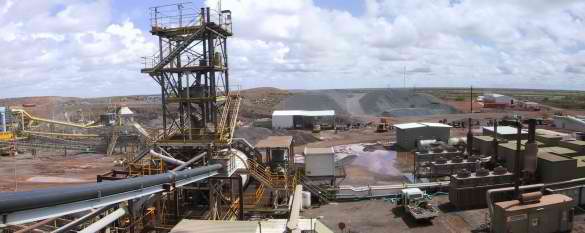
Waste water is pumped to a central treatment plant where it is treated through trickling filtration tanks and extended aeration activated sludge tanks.

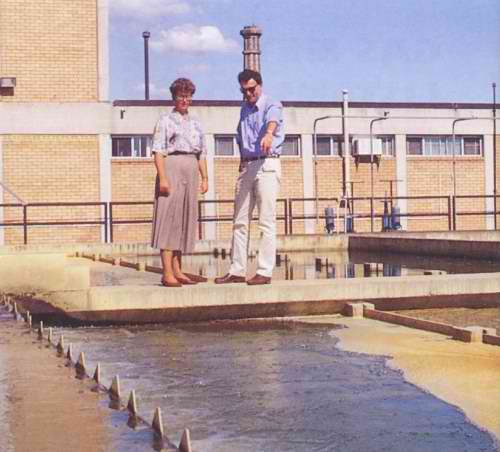
Sandra Gamble and Wariwck Battye-Smith check the water filtration operation, in the background is the chimney from the boiler house of the first Bathurst water pumping works built in the 1890s.

The cost of electricity for the water supply and disposal system averages over $500,000 per year, making the account the biggest single component of the Bathurst City Council electricity bill and the twelfth biggest customer of Southern Mitchell Electricity. The majority of this electricity is used in water pumping operations.

Over the most recent twelve month period, the water filtration plant used 3,182,243 kilowatt hours at a cost of $340,784. The Blayney Road pumping station used 519,840 kWh at a cost of $62,094 and the waste water treatment plant used 1,182,640 kWh at a cost of $129,957.

The Council’s Water and Waste Water Engineer, Warwick Battye-Smith, asked Southern Mitchell’s Planning Engineer, Sandra Gamble, for assistance with an initial survey to examine the potential for energy savings.

They determined that large savings were possible, especially in the areas of tariff changes and power factor correction, and recommended that the Bathurst City Council commission an energy management consultant to carry out a complete audit.

Denis Cooke of Denis Cooke and Associates was selected as an accredited energy auditing organisation. The master list of accredited organisations is maintained by the Institute of Engineers Australia and is available from Institute offices in each state.

The audit revealed potential savings in excess of.$120,000 per year for a once only cost of $94,000, including the cost of the audit.

As expected, the largest yearly saving involved the changing of the tariff under which the council was buying electricity. The council decided to go on to a three part time-of-use tariff, which includes three energy rates for use in peak, shoulder and off peak periods together with a comparatively smaller maximum demand charge.

This enables a $90,000 saving to be made by rescheduling pumping from the filtration plant to the reservoirs to off peak hours.

Southern Mitchell’s cost of supply is lower in off peak periods and savings are passed on to clients to encourage them to move operations to these hours. This also minimises system demand peaks and delays the need for future capital expansion.

Comparison of the capacity of the reservoirs and water use characteristics indicated that off peak pumping could supply demand during the greater part of the year and pumping in shoulder tariff times will only occasionally be required.

A similar restructuring of pumping operating schedules at the waste water treatment plant could save $5,300 by shifting as much as possible of the pumping activity to the off peak period.

Savings of over $24,000 per year were identified as being available from the installation of power factor correction equipment at a cost of $20,000.

The installation of transducers, power and flow monitoring instrumentation and energy reporting computer software was recommended so that individual pump performances can be monitored and managed for maximum energy and cost conservation. The information gained would also show which of the pumps perform the most efficiently and when deteriorating performance indicates that overhaul or replacement is due.

Recalibration of measuring equipment was also suggested as a discrepancy was found between the records of volume of water pumped and the capacities of the pumps plus spot measurements of flows.

The energy required to pump water can often by reduced by using variable drives to slow down the water velocity in the pipes to minimise friction losses. At Bathurst, friction losses are already low because of relatively short pumping distances and generous pipe sizes. This allows for maximum pumping in off peak tariff hours and a strategy to use the available pumps in combinations that will keep them operating at the most efficient load level on their performance characteristics curve.

As an example of this, the pumping station at the filtration plant has four pumps, two high voltage 375 kW pumps and two low voltage 190 kW pumps. In the past, the strategy was to use one large pump and one small pump to stay within the 500 kVA limit of the tariff that has now been eliminated. Using the two big pumps results in a 16% gain in efficiency and a 5% loss through additional pipe friction resulting in an overall efficiency gain of 11%. The two big pumps can also do the job faster and make it easier to keep pumping operations within the cheaper off-peak schedule.

The two smaller pumps combined have the same capacity as one of the bigger pumps so they can be kept in reserve in case of a big pump malfunction.

Another interesting suggestion involves the Chifley Dam, which is to have its wall height and storage capacity increased in the near future. The extra height will give sufficient head for the installation of a 700 kilowatt hydro generator in place of the needle valves which are required to provide a steady release of water into the river to supply Bathurst.

An electrically powered air compressor is used to aerate the dam to improve water quality. The consumption of the compressor averages 3300 kilowatt hours per month at a cost of $500 on the Off Peak Two tariff.

The hydro generator proposal is being investigated together with capital outlay, ownership and operating strategies. Southern Mitchell is very interested in the proposed project and the possibility of feeding surplus electricity, above that needed by the compressor, into the supply network.

An area of potential saving identified was the elimination of illegal connections from roof gutters to the sewers. In rainy periods, these increase the volume of waste water that must be pumped. The potential for savings is approximately $5000 per year.

Methane generated in the primary digester of the central waste water treatment plant is used to power a small heating system to maintain the digester at a temperature of 24EC. Excess methane is flared and one proposal was for this to be metered to determine whether there was sufficient volume for further utilisation.

Major issues raised are being addressed immediately while others are being considered or implemented as part of the ongoing maintenance schedule.

Warwick Battye-Smith considers that energy consumption and conservation should be an ongoing part of the operations and something that should be integrated into any capital upgrade or installation proposal. “Nowadays someone in my position cannot be classified only as an engineer,” he said.

“Instead I must be a manager and must continually ask the questions: ‘Are we doing it as well as possible?’ and ‘Can we improve our performance?”

“I have to know where to find the right information and know to call in the experts for help. What we have done demonstrates conclusively that we must work closely with our local electricity supply authority if we-want to achieve any real savings!”

Further information, phone Denis Cooke on (02) 9871 6641, or Warwick Battye-Smith on (02) 6333 6225.

Denis Cooke completing the energy audit report on the Bathurst water and sewerage services.  
Part of the cost of the audit was covered by a DPIE Enterprise Energy Audit Program grant.